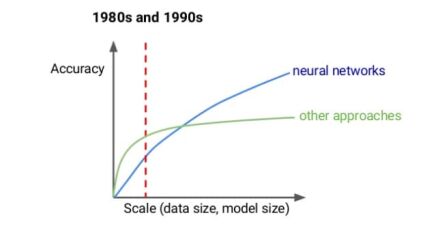
Any Data Science expert will tell you that it’s always better to have too much data than too little. And, for Deep Learning, it couldn’t be more true – the more examples you have, the more accurately the connections between neurons correspond to the chain of transitions based on which the system will make a decision.
There are also methods that help calculate the minimal dataset needed depending on the task you’re trying to solve. For example, historically, for the classification using Deep Learning the rule of thumb would be 1k of samples per class. From my own experience, I can tell that this number can shrink if you use pre-trained models, suited to your classification. In my case, the use of a pre-trained model for facial recognition or facial identification allowed me to only use 10 images of a person to be able to successfully identify them.
Of course, you shouldn’t forget about the quality of the data. For example, an imbalanced dataset will negatively impact the results of a binary classification, because one class will dominate in terms of the number of samples inside a dataset. The problem can be solved by means of evaluating not the accuracy, but the precision and recall, using imbalance correction techniques. However, according to this research, the increase of the dataset will be a much better solution to this problem.
Before getting into details, let’s understand the process of gathering data in machine learning.
Understanding the Data Collection Process
The information data that is formatted in a particular way is called data. Hence, data collection is the process of gathering, measuring, and analyzing accurate data from a variety of relevant sources to find answers to research problems, answer questions, evaluate outcomes, and forecast trends and probabilities. Accurate data collection is necessary to make informed business decisions, ensure quality assurance, and keep research integrity. During data collection, the researchers must identify the data types, the sources of data, and what methods are being used.
1. Defining the Problem Statement
Clearly outline the objectives of the data collection process and the specific research questions you want to answer. This step will guide the entire process and ensure you collect the right data to meet your goals.
Also, it is recommended to identify data sources. Determine the sources from which you will collect data. These sources may include primary data (collected directly for your study) or secondary data (previously collected by others). Common data sources include surveys, interviews, existing databases, observation, experiments, and online platforms.
2. Planning Data Collection
In this stage, it is better to start with the selection of data collection methods. Choose the appropriate methods to collect data from the identified sources. The methods may vary depending on the nature of the data and research objectives.
Common methods include:
Surveys: Structured questionnaires administered to a target group to gather specific information.
Interviews: Conducting one-on-one or group conversations to gain in-depth insights.
Observation: Systematically observing and recording behaviors or events.
Experiments: Controlling variables to study cause-and-effect relationships.
Web scraping: Extracting data from websites and online sources.
Sensor data collection: Gathering data from sensors or IoT devices.
The next logical step would require designing data collection instruments. If using surveys or interviews, create well-structured questionnaires or interview guides. Ensure that the questions are clear, unbiased, and aligned with the research objectives.
After these steps have been accomplished you may start the process of piloting the data collection process. Before the main data collection, conduct a pilot study to test the data collection instruments and methods. This helps identify any issues and allows for necessary adjustments to improve the data quality.
Only after that – collecting data. Implement the data collection process according to the chosen methods and instruments. Ensure the data is recorded accurately and completely.
3. Ensuring Data Quality
The next step is very crucial. Ensuring data quality means reviewing the collected data to check for errors, inconsistencies, or missing values. Apply quality assurance techniques to ensure the data is reliable and suitable for analysis.
The following step would be data storage and management. It will require organizing and storing the collected data in a secure and accessible manner. Consider using databases or other data management systems for efficient storage and retrieval.
After that, you might need to go with data cleaning and preprocessing. Prepare the data for analysis by cleaning and preprocessing it. This involves handling missing values, removing duplicates, and transforming data into a suitable format.
How to Start Collecting Data for ML: Data Collection Strategy
For some companies, there shouldn’t be any problems with data collection in Machine Learning, since they’ve been gathering all this data for years and piles of papers and documents are now only waiting to be digitized. Or, if they had thought about it before, all documents have already been transferred into an electronic format. If this is your case – you are lucky, and your problem is now to prepare that data, process it, and decide on the usability for the task at hand.
If you don’t have luck, and you don’t have any data, do not despair – in the 21st century, you can find a reference dataset online and use it to solve your task. The dataset can be publicly accessible, or you might need to purchase it.
While you’ll be occupied with analyzing the dataset, you should also start the process of collecting your own data in the right shape and format. It could be the same format as in the reference dataset (if that fits your purpose), or if the difference is quite substantial – some other format.
The data are usually divided into two types: Structured and Unstructured. The simplest example of structured data would be a .xls or .csv file where every column stands for an attribute of the data. Unstructured data could be represented by a set of text files, photos, or video files. Often, business dictates how to organize the collection and storage of data. For example, if the task is to build a system that could detect pneumonia from an image of the lungs, you need specialized equipment to create a catalog of digital images. At the same time, if you need to create a recommendation system for eCommerce, there’s no need for any additional technical solutions; all the needed data is provided by the user when purchasing a product.
Where can you “borrow” a dataset? Here are a couple of data sources you could try:
Dataset Search by Google – allows searching not only by the keywords, but also filtering the results based on the types of the dataset that you want (e.g., tables, images, text), or based on whether the dataset is available for free from the provider.
Visual Data Discovery – specializes in Computer Vision datasets, all datasets are explicitly categorized and are easily filtered.
OpenML – as stated in the documentation section it’s ‘an open, collaborative, frictionless, automated machine learning environment’. This is a whole resource that allows not only sharing data, but also working on it collaboratively and solving problems in cooperation with other data scientists.
UCI: Machine Learning Repository – a collection of datasets and data generators, that is listed in the top 100 most quoted resources in Computer Science.
Awesome Public Datasets on Github- it would be weird if Github didn’t have its own list of datasets, divided into categories.
Kaggle – one of the best, if not the best, resource for trying ML for yourself. Here you can also find data sets divided into categories with usability scores (an indicator that the dataset is well-documented).
Amazon Datasets – lots of datasets stored in S3, available for quick deployment if you’re using AWS.
and many other excellent resources where you can find data sets from versatile areas: starting from the apartment prices in Manhattan for the last 10 years and ending with the description of space objects.
Still lacking sample data? You might need…
Data Augmentation
Let’s imagine for a second that we were not able to find a dataset that would meet all our requirements, BUT at the same time, we have a certain amount of basic data. Can we work with it? Yes, we can, but we’ll need to apply augmentation methods to our dataset to increase the number of samples.
Definition: Data augmentation is the increase of an existing training dataset’s size and diversity without the requirement of manually collecting any new data.Source.
The process of data augmentation means that the input data will undergo a set of transformations and this way, thanks to the variations of data samples, our dataset will become richer. For example, if we deal with images, the number of augmentations that we can utilize is sufficient, because an image can be cut, mirrored, turned upside down, etc. Moreover, we can change the color settings with the help of brightness, saturation, contrast, clarity, and blur. These are the so-called ‘photometric transformations’.
The most popular ML frameworks provide quite advanced means for image augmentation:
TensorFlow – allows to set ranges for rotation angles, brightness, zoom, rescale, etc. There’s an option to turn on a built-in transformer feature in the generation flow of new samples.
Scikit Image – a great library that helps not only to conduct basic operations with images, but also works with color spaces and allows you to apply filters.
OpenCV – a pioneer of Computer Vision. In this Python-based library, there are tools for rotation, scaling, filters, cropping, etc.
Synthetic Data Generators
Ok, we figured out the images, but what if we have tables with data, but there’s not enough data – where do we get more? In this case, we can turn to data generators, but to use them we need to understand the rules and laws of how a dataset is formed. The importance of synthetic data cannot be overestimated. They can help when:
you need to test a new product, but you don’t have any real-life data. Imagine, for example, an engine or sensor on the space probe: it will begin collecting data already in space or even on another planet, but you need to check how it would work when it’s still on Earth.
there’s an important matter of sensitive data and its privacy – and the access to real data is limited. It is especially the case when we deal with medical data or sensitive personalized data.
you need to expand the training dataset for the ML model – this happens to be our situation!
In general, data generators can be split into two broad groups:
the ones that use some distribution model to generate data. It can be a distribution based on the real data, or, in the absence of such, a choice in favor of any of the distributions is made by the data scientists based on their knowledge in the given field. In many cases, the Monte Carlo method is used for the task.
the ones that use Deep Learning techniques: Generative Adversarial Network(GAN) and Variational Autoencoder(VAE). Both of these methods rely on neural networks to generate data and require an excellent knowledge of the field from a data scientist.
If we take Python (as one of the best programming languages for ML), we’ll have a choice among the following tools:
The well-known Scikit-learn – one of the most widely used libraries with Python for ML. It contains tools to generate synthetic data not only for classification and regression tasks, but also for clusterization.
SymPy is a fantastic library that helps in solving the problem of symbolic expression input. SymPy can simplify expressions, compute derivatives, integrals, and limits, solve equations and work with matrices.
Pydbgen is a lightweight library for categorical data generation. It can generate random entities, like names, emails, credit card numbers, phone numbers and export this data into Excel files or SQLite tables.
Lazy Learning
Another ‘magic wand’ for cases when it’s hard to “flesh out” the training dataset is Transfer Learning.
Definition: Transfer learning is an area in ML that utilizes the knowledge gained while solving one problem to solve a different, but, related problem.
It’s just the way the human brain works: it’s easier for us to learn new things if we’ve had similar experiences in the past. Let’s say, it’s easy to learn to ride a bike if you mastered a bike with training wheels before that. Learning a new programming language when you’ve been programming using other languages also shouldn’t be as hard. Just like with ML – you shouldn’t reject the existing experience, even if this experience is somebody else’s and provided for public use.
Along with the rise of Computer Vision in recent years, the use of pre-trained models for object classification and identification has become a thing. Even now, in order to train a model for image classification, it will take days of processing. Taking into account the iterative and repetitive nature of Data Science, the search for the best model parameters can drag on for months. That is why the use of pre-trained models can save a lot of time and effort for data scientists in cases when you need a lot of input data for the evaluation of your hypothesis.
Here are some of the great examples of pre-trained models for Image Classification:
Latest Trends in Data Collection for Machine Learning
Machine learning and artificial intelligence is a field that drives major innovations across different industries. It is predicted that in 2023, the AI market will reach $500 billion, and in 2030, $1,597.1 billion in size. This means that machine learning technologies will continue to be in high demand in the near future.
Let’s look deeper into the latest trends in data collection for ML.
1. Synthetic Data Generation
Synthetic data is any information manufactured artificially which does not represent events or objects in the real world. Algorithms create synthetic data used in model datasets for testing or training purposes. This data can mimic operational or production data and help train ML models or test out mathematical models.
Why is it so important? According to Gartner, the use of synthetic data is gaining wide acceptance because it can provide several benefits over real-world data. By 2025, 60% of the data used for developing AI and analytics will be artificially produced.
Generating synthetic data along with labels is increasingly being used in machine learning due to its low cost and flexibility. A simple method is to start from a probability distribution and generate a sample from that distribution using tools like sci-kit learn. In addition, to lower costs, synthetic data helps address privacy issues associated with potentially sensitive data sourced from the real world. It can also reduce bias compared to real data, which might not accurately reflect the full range of information about the real world. Synthetic data can provide greater diversity by including rare cases that represent realistic possibilities but may be difficult to source from authentic data.
Moreover, there are more advanced techniques like Generative Adversarial Networks (GANs) and application-specific generation techniques. It’s worth mentioning that generating synthetic text data has also been studied in the natural language processing community. Paraphrasing is a classical problem of generating alternative expressions that have the same semantic meaning.
For example “What does X do for a living?” is a paraphrase of “What is X’s job?”. There are two recent methods – one is syntax-based and the other semantics-based – that use paraphrasing to generate large amounts of synthetic text data. Syntactically controlled paraphrase networks (SCPNs) can be trained to produce paraphrases of a sentence with different sentence structures.
Semantically equivalent adversarial rules for text (SEARs) have been proposed for perturbing input text while preserving its semantics. SEARs can be used to debug a model by applying them to training data and seeing if the re-trained model changes its predictions.
2. Active Learning
Active learning is a machine learning technique that focuses on selecting the most informative data points to label or annotate from an unlabeled dataset. The aim of active learning is to reduce the amount of labeled data required to build an accurate model by strategically choosing which instances to query for labels. This is especially useful when labeling data can be time-consuming or expensive.
Active Learning in Data Collection: Steps
Step
Features
Initial Data Collection
Initially, a small labeled dataset is collected through random sampling or any other standard method.
Model Training
The initial labeled data is used to train a machine learning model.
Uncertainty Estimation
The model is then used to predict the labels of the remaining unlabeled data points. During this process, the model’s uncertainty about its predictions is often estimated. There are various ways to measure uncertainty, such as entropy, margin sampling, and least confidence.
Query Strategy Selection
A query strategy is chosen to decide which data points to request labels for. The query strategy selects instances with high uncertainty as these instances are likely to have the most impact on improving the model’s performance. There are a few methods to apply query strategy selection: uncertainty sampling, diversity sampling, and representative sampling.
Labeling New Data Points
The selected instances are then sent for labeling or annotation by domain experts.
Model Update
The newly labeled data is added to the labeled dataset, and the model is retrained using the expanded labeled set.
By using active learning, you can achieve better model performance with fewer labeled samples compared to traditional supervised learning methods that require large amounts of labeled data. It is particularly valuable in scenarios where data labeling is costly, time-consuming, or difficult to obtain.
3. Transfer Learning
It is a popular approach for training models when there is not enough training data or time to train from scratch. A common technique is to start from an existing model that is well trained (also called a source task), one can incrementally train a new model (a target task) that already performs well. For example, a convolutional neural network like AlexNet and VGGNet can be used to train a model for a different, but related vision problem. Recently, Google announced TensorFlow Hub which enables users to easily reuse an existing model to train an accurate model, even with a small dataset.
4. Open Source Datasets
Open source datasets are a valuable resource in data collection for various research and analysis purposes. These datasets are typically publicly available and can be freely accessed, used, and redistributed. Leveraging open source datasets can save time, resources, and effort, as they often come pre-cleaned and curated, ready for analysis.
Common Methods For Utilizing Open Source Datasets in Data Collection:
Open Source Datasets Methods
Features
Identifying Suitable Datasets
Start by identifying the relevant open source datasets for your research or analysis needs. There are various platforms and repositories where you can find open source datasets, such as Kaggle, data.gov, UCI Machine Learning Repository, GitHub, Google Dataset Search, and many others.
Data Exploration
Before using a dataset, it’s essential to explore its contents to understand its structure, the variables available, and the quality of the data. This preliminary analysis will help you determine if the dataset meets your research requirements.
Data Licensing
Pay close attention to the licensing terms associated with the open source dataset. Some datasets might have specific conditions for usage and redistribution, while others may be entirely open for any purpose. Make sure to adhere to the terms of use.
Data Preprocessing
Although open source datasets are usually pre-cleaned, they may still require some preprocessing to fit your specific needs. This step could involve handling missing data, normalizing values, encoding categorical variables, and other data transformations.
Ethical Considerations
Ensure that the data you are using does not contain sensitive or private information that could potentially harm individuals or organizations. Respect data privacy and consider anonymizing or de-identifying data if necessary.
Data Integration
In some cases, your research might require data from multiple sources. Open source datasets can be combined with proprietary data or other open source datasets to enhance the scope and depth of your analysis.
Validation and Quality Control
Just like with any data, it’s crucial to validate the open source dataset for accuracy and quality. Cross-referencing the data with other sources or performing sanity checks can help ensure the dataset’s reliability.
Citations and Attribution
When using open source datasets in your research or analysis, it’s essential to give proper credit to the original creators or contributors. Follow the provided citation guidelines and acknowledge the source of the data appropriately.
Reproducibility
If your research involves publishing results or sharing analyses, make sure to share the exact details of the open source datasets you used. This ensures that others can replicate your work and verify your findings.
By following these methods and considerations, you can effectively use open source datasets as a valuable resource in your data collection process, contributing to the broader research community and advancing your own projects.
5. Manual Data Generation
Manual data generation refers to the process of collecting data by hand, without the use of automated tools or systems. Manual data generation can be time-consuming and resource-intensive, but it can yield valuable and reliable data when performed carefully.
Manual Data Generation Methods in Data Collection
Manual Data Generation Methods
Description
Surveys and Questionnaires
Researchers design surveys or questionnaires to gather information directly from respondents. These can be administered in person, over the phone, via email, or through online platforms. Manual data entry may be required to record the responses.
Observations
Researchers directly observe and record data on certain behaviors, events, or phenomena. This approach is common in social sciences and ethnographic studies.
Interviews
Conducting interviews, either face-to-face or through phone calls, allows researchers to gather qualitative data directly from participants. Manual note-taking or recording of responses is typically necessary.
Content Analysis
Involves manually reviewing and categorizing data from various sources, such as documents, articles, or social media posts, to identify patterns or themes.
Manual Extraction from Physical Sources
When dealing with data that exists in physical forms, such as books, handwritten records, or photographs, manual transcription or data extraction may be necessary.
Manual Labeling or Annotation
In machine learning and AI, manually annotating data with labels or tags can be crucial for training algorithms in supervised learning tasks.
Field Studies
Researchers collect data in real-world settings, making direct observations and recording relevant information manually.
Diaries or Logs
Participants may be asked to keep diaries or logs of their activities, experiences, or behaviors over a certain period.
Handwritten Surveys or Data Collection
In some cases, data might be collected using pen and paper, and then manually transcribed into digital formats for analysis.
It’s essential to ensure the manual data collection process is well-structured and documented to minimize errors and maintain data quality.
6. Building Synthetic Datasets
Building synthetic datasets is one of the most common methods in data collection when real data is limited or unavailable, or when privacy concerns prevent the use of actual data. Synthetic datasets are artificially generated datasets that mimic the statistical properties and patterns of real data without containing any sensitive or identifiable information.
Here’s a step-by-step guide on how to build synthetic datasets:
Define the Problem and Objectives: Clearly identify the purpose of the synthetic dataset. Determine what specific features, relationships, and patterns you want the synthetic data to capture. Understand the target domain and data characteristics to ensure the synthetic dataset is meaningful and useful.
Understand the Real Data: If possible, analyze and understand the real data you want to emulate. Identify the key statistical properties, distributions, and relationships within the data. This will help inform the design of the synthetic dataset.
Choose a Data Generation Method: Several methods can be used to create synthetic datasets (Statistical Methods, Generative Models, Data Augmentation, Simulations ).
Choose the Right Features: Identify the essential features from the real data that need to be included in the synthetic dataset. Avoid including personally identifiable information (PII) or any sensitive data that might compromise privacy.
Generate the Synthetic Data: Implement the chosen data generation method to create the synthetic dataset. Ensure that the dataset follows the same format and data types as the real data to be used seamlessly in analyses and modeling.
Validate and Evaluate: Assess the quality and accuracy of the synthetic dataset by comparing it to the real data. Use metrics and visualizations to validate that the synthetic data adequately captures the patterns and distributions present in the real data.
Modify and Iterate: If the initial synthetic dataset does not meet your expectations, refine the data generation method or adjust parameters until it better aligns with the desired objectives.
Use Case Considerations: Understand the limitations of synthetic datasets. They might not fully capture rare events or extreme cases present in real data. Consequently, synthetic datasets are best suited for certain use cases, such as initial model development, testing, and sharing with third parties.
Ensure Privacy and Ethics: Always prioritize privacy and ethical considerations when generating synthetic datasets. Ensure that no individual or sensitive information can be inferred from the synthetic data.
By following these steps, you can create synthetic datasets that can serve as valuable substitutes for real data in various scenarios, contributing to better model development and analysis in data-scarce or privacy-sensitive environments.
7. Federated Learning
Federated learning is a privacy-preserving machine learning approach that enables multiple parties to collaboratively build a global machine learning model without sharing their raw data with a central server. This method is particularly useful in scenarios where data privacy and security are major concerns, such as in healthcare, financial services, and other sensitive industries. Federated learning works by allowing each participant to train a local model on their respective data and only the model updates are shared and aggregated to create a global model.
Technologies and Tools for Data Collection
There are various technologies and tools available for data collection, each tailored to specific data sources and objectives.
1. Web Scraping
Web scraping tools are software developed specifically to simplify the process of data extraction from websites. Data extraction is quite a useful and commonly used process however, it also can easily turn into a complicated, messy business and require a heavy amount of time and effort.
A web scraper uses bots to extract structured data and content from a website by extracting the underlying HTML code and data stored in a database.
Bright Data. It scrapes data from the internet at scale with no infrastructure requirements. It can instantly extract data publicly available from any site, so you can fuel your web scraping or research requirements.
Oxylabs Scraper API. This tool is designed to collect real-time data from websites at scale. This web scraping tool serves as a trustworthy solution for gathering information from complicated targets and ensures the ease of the crawling process. Web Scraper API best fits cases such as website changes monitoring, fraud protection, and travel fare monitoring.
Apify. Apify is a one-stop platform for web scraping and web automation. It enables companies ranging from startups to Fortune 500 corporates to automate any workflow that can be done manually in a web browser.
Scrape.do. Scrape.do allows you to start collecting any HTML, JSON, XML, etc. data from a target web page with rotating proxies immediately by integrating in 30 seconds.
ParseHub. ParseHub is a free web scraper that is easy to use. With this web scraper, extracting data is as easy as clicking on the data you need.
Diffbot. Diffbot provides a suite of products built to turn unstructured data from across the web into structured, contextual databases. Diffbot’s products are built off of cutting-edge machine vision and natural language processing software that’s able to read billions of documents every day.
Scrape-It.Cloud. Scrape-It.Cloud is an API for web scraping, which will help you solve scraping tasks of any complexity and scrape websites, solving issues with proxies, IP blocking, geotargeting, CAPTCHA solutions, and much more.
Octoparse. Octoparse is a cloud-based web data extraction solution that helps users extract relevant information from various types of websites. It enables users from a variety of industries to scrape unstructured data and save it in different formats including Excel, plain text, and HTML.
ScrapingBee. ScrapingBee is an API for web scraping, designed for small and large companies. Supply a URL, and ScrapingBee will handle headless browsers, proxies, and CAPTCHAs solving. ScrapingBee renders web pages like a real browser, manages instances using Chrome, and focuses on data extraction.
Scrapingdog. Scrapingdog’s Web Scraping API allows businesses to easily and efficiently extract valuable data from the web, saving them time and resources.
Grepsr. Grepsr is a forward-thinking web scraping service that puts the power of data extraction in the hands of enterprises. Grepsr’s platform offers a user-friendly interface that empowers our clients to effortlessly navigate through the data extraction process.
Scraper API. ScraperAPI handles proxies, browsers, and CAPTCHAs, so it enables getting the HTML from any web page with a simple API call.
Scrapy. Scrapy is an open source and collaborative framework for extracting the data customers need from websites.
Import.io. Import.io delivers a SaaS product that enables users to convert the mass of data on websites into structured, machine-readable data with no coding required. The point-and-click interface transforms websites into data with a few simple clicks, enabling anyone to get the data they need even behind a login. Our highly efficient and scalable platform allows customers to process 1,000s of URLs concurrently or on a schedule and gain access to millions of rows of data that they use for hundreds of different use cases.
2. Application Programming Interfaces
APIs are interfaces that allow developers to interact with specific platforms, services, or databases to retrieve data programmatically. APIs enable seamless data extraction, making it easier to integrate data from various sources into applications, websites, or data analysis pipelines.
It’s important to keep in mind that APIs often have rate limits, usage restrictions, and terms of service that developers need to comply with while using them for data collection. Additionally, some APIs may require authentication using API keys or tokens to ensure secure access to data. When using data collection APIs, developers should also be mindful of data privacy and ethical considerations, especially when dealing with sensitive or personal information.
3. Data Labeling and Annotation
Data Labeling and Annotation are needed because they enable the training of supervised learning models, where the algorithm learns from labeled examples to make predictions on new, unseen data.
But these are two different processes. Let’s have a look at data labeling. Labeling allows to assign specific labels or categories to different data points. These labels represent the ground truth or the correct output corresponding to the input data. The process is usually done manually by human annotators or crowd-workers who have domain knowledge or expertise in the data domain. Data labeling can take various forms depending on the type of data and the requirements of the machine learning task. Some common types of data labeling include image or text labeling, audio or video labeling, and structured data labeling. For example, assigning labels to specific fields in structured data formats like CSV, JSON, etc.
Regarding data annotation, it goes beyond labeling. In addition to assigning labels, annotation involves adding more information or context to the data to make it more informative and useful for training machine learning models. Annotation can involve different tasks such as bounding box annotation (drawing rectangles around objects in images to indicate their location and boundaries), segmentation (creating pixel-level masks to segment objects in an image, named entity recognition (identifying and tagging specific entities), and sentiment analysis (annotating text with sentiment labels such as positive, negative, or neutral).
Data labeling and annotation are often resource-intensive and time-consuming processes, especially for large datasets. To solve this issue, automated or semi-automated tools are sometimes used to assist with data labeling tasks.
4. Data Collection Platforms
Data Collection Platforms from the name we can understand that these are software platforms or tools, online services that facilitate the collection, storage, and management of data from various sources. These platforms are designed to streamline the data collection process, making it more efficient, accurate, and organized.
For example, it can survey platforms like SurveyMonkey, Google Forms, and Qualtrics. Another example would be data collection apps. They are mobile applications used to collect data in the field using smartphones or tablets. Some popular data collection apps are Magpi, ODK Collect (Open Data Kit), and SurveyCTO.
What about IoT platforms? IoT platforms are used to collect, manage, and analyze data from connected devices and sensors in IoT applications. These platforms enable the integration and communication of data from various IoT devices, allowing users to monitor and control connected systems. Examples of IoT platforms include IBM Watson IoT Platform, Microsoft Azure IoT Hub, and AWS IoT Core.
Also, we can mention social media monitoring tools like Hootsuite, Brandwatch, and Sprout Social. Apart from that, web scraping tools are worth mentioning.
Data collection platforms play a vital role in efficiently gathering and managing data, helping organizations make informed decisions and gain valuable insights from the collected information. The choice of platform depends on the specific data collection needs, the type of data to be collected, and the industry or application for which the data is being collected.
How to Work with Existing Data: Data Cleaning, Labeling
What is Machine Learning?
Now that we have data, it’s high time to figure out what Machine Learning is. In simple words, ML means extracting knowledge from data.
Definition: “Machine Learning – it’s a field of study that gives computers the ability to learn without being explicitly programmed” – Arthur Samuel
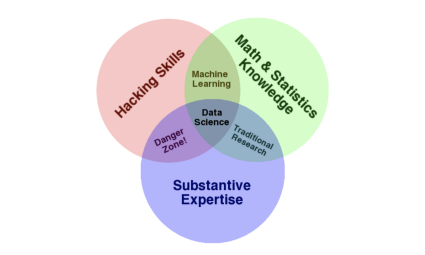
If we look at Drew Conway’s Venn diagram of data science, we can see clear areas that interact with ML: Computer Science, Math, and Statistics. You will also notice on the diagram that ML is a subset of Data Science, but we’ll come back to that later.
Computer Science, Math, and Statistics diagram
ML has many subfields and applications, including neural networks(NN), genetic algorithms, data mining, computer vision, natural language processing (NLP), and others. Depending on what we’re trying to achieve from the output and which data we have on the input, we can define 3 main types of ML:
Supervised learning: the goal here would be to train a model that allows predictions to be made on unseen future data. For this to happen data must be labeled;
Unsupervised learning: this type of learning works with unlabeled data and its goal would be to find hidden patterns in this data, and, probably some meaningful information;
Reinforcement learning: the goal here would be to develop a system that learns and improves over time by interacting with the environment.
The choice among the three depends on the problem we’re trying to solve, which in turn, stems from the questions we should have asked ourselves (and answered, preferably) at the very beginning. If the problem has to do with classification (distinguishing cats from dogs in a photograph) or regression (predicting the weather for next month), our top choice is Supervised learning. If we have unlabeled data and need to perform clustering(segment the customers of an online store) or dimensionality reduction(remove the extra features from a model) or anomaly/outlier detection(find users with strange or suspicious websites browsing patterns) – use Unsupervised learning. As you can see, these two types of ML solve a broad spectrum of tasks, and the main difference between them, besides the tasks, lies in data: Supervised learning uses labeled data, while Unsupervised learning doesn’t necessarily need to.
Where does Labeled Data dwell?
So, say, we find ourselves with a completely unlabeled OR partially labeled dataset in our hands and a multi-classification problem we need to solve with it. Where do we go from here and how do we get our dataset labeled?
First of all, we need to figure out what Data Labeling is.
Data Labeling – it’s the process of data tagging or annotation for use in machine learning.
Labels are different and unique for each specific dataset, depending on the task at hand. The same dataset can have different meanings of labels and use them for various tasks. For example, the classification of cats and dogs can turn into the classification of animals that have spots on the fur and the ones that don’t.
Depending on the size and complexity of the dataset, the size of the in-house Data Science team, and also the time and budget, we can have several variations of how the Data Labeling process is organized:
Crowdsourcing: a third-party gives a platform for individuals and businesses to outsource their processes and jobs;
Outsourcing: hiring freelancers or contractors;
Specialized teams: hiring teams that work in the field of Data Labeling and are trained and managed by third-party organization;
In-house teams: giving tasks of Data Labeling to the internal team of workers or data scientists.
Each of these has its own pros and cons(such as the quality of the results, the cost of the job, or the speed in which labeling is completed), and one method that suits one endeavor may not work for another. Moreover, you can combine them as you go.
If you cannot afford to hire a dedicated team for Data Labeling and you’ve decided to do everything in-house, you can’t do without software tools to help with your task:
LabelBox, Annotorious, VGG Image Annotator, VoTT, ML Kit for Firebase – images annotation tools
Anvil, VoTT, VGG Image Annotator, CVAT – video annotation tools
Stanford CoreNLP, Brat, Dataturks, Tagtog – text annotation tools
Ok, but can we partially use labeled data and conduct the labeling for the whole dataset? Yes, we can, with the help of Semi-Supervised Learning(SSL).
Definition: Semi-supervised learning is an approach to machine learning that combines a small amount of labeled data with a large amount of unlabeled data during training. – Wiki
The use of semi-supervised learning is especially helpful when there are reasons you can’t get a fully labeled dataset – reasons that might be financial or time-related, while the amount of unlabeled data is sufficient. Unlike supervised learning (which needs labeled data) and unsupervised learning (which works with unlabeled data), semi-supervised learning methods can handle both types of data at once. This way, using SSL we can turn the problem of a small labeled dataset into an advantage and build a process where a big unlabeled dataset will iteratively get labeled thus increasing the general usability of our solution. This approach is successfully applied in various areas, for example in Healthcare during the classification of cancerous malformations.
The easiest SSL method would consist of the following steps:
train your classifier with labeled data;
apply this classifier to the unlabeled data and get the classes’ probability information;
assign labels to the most confident data samples;
train the classifier with newly labeled data added to the initial labeled dataset;
repeat until some convergence criterion is met.
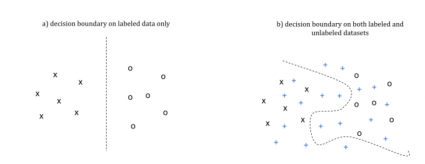
decision boundary for a labeled dataset and both labeled and unlabeled data
As shown in image a) above, the decision boundary for a labeled dataset only can be relatively simple and not reflect the real dependencies inside the dataset. At the same time, when you have a fully annotated dataset with both labeled and unlabeled data, the decision boundary might be absolutely different – see image b).
To sum up Data Labeling, I’d like to add that the accuracy of data labeling greatly influences the model’s performance, thus making the process of Data Labeling one of the key factors in the pre-processing of data. To mitigate the impact of mislabeling, it’s worth taking a Human-in-the-Loop (HITL) approach: this is when a human controller keeps an eye on the model’s training and testing throughout its evolution.
What is Data Science All About?
The term Data Science itself was coined by the Danish scientist Peter Naur in his book “Concise Survey of Computer Methods”(Studentlitteratur, Lund, Sweden, ISBN 91-44-07881-1, 1974). He disliked the term ‘computer science’ and was standing firmly on distinguishing the data processing field from pure computer disciplines. Therefore, he proposed the term ‘datalogy’ or “data science”. Funnily enough, he was the first professor of datalogy at the University of Copenhagen, which was founded in 1969. Another interesting fact is that ‘datalogy’ is mostly used in Scandinavian countries when the rest of the world uses the term “data science”.
But enough with the history, let’s bring it back to modern-day, and specifically to Drew Conway’s Venn diagram of data science. It suggests that data scientists should have the following skillset:
Programming or hacking skills
Math & Statistics
Subject matter expertise for a given field.
Quote:”…data plus math and statistics only gets you machine learning, which is great if that is what you are interested in, but not if you are doing data science. Science is about discovery and building knowledge…:” – Drew Conway
“Discovery and building knowledge” – sounds exciting and intriguing, but where do we start and how do we build the process itself? It looks like we need to introduce one more term, or even two: Data Mining(DM) or Knowledge Discovery in Databases(KDD).
Definition: Data Mining is a process of extracting and discovering patterns in large data sets involving methods at the intersection of machine learning, statistics, and database systems.- Wiki
As for the “Knowledge Discovery in Databases” term, itwas introduced by Gregory Piatetsky-Shapiro in 1989 for the very first workshop on the same topic. During those times, in general, KDD == Data Mining, and those terms are still used interchangeably most of the time. But if KDD lives among the AI/ML developers, Data Mining is more popular within the business community.
As ML and DM grew, frameworks describing the building process of ML systems also developed. At the moment, we can distinguish between the three most popular data mining process frameworks used by the data miners:
Knowledge Discovery Databases (KDD)
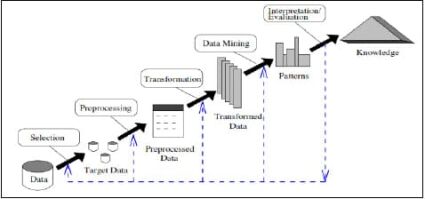
This process was introduced by Fayyad in 1996. He describes it as a set of various technologies and methodologies to manage data. Yes, Data Mining is at the heart of KDD.
Knowledge Discovery Databases for Data Collection in ML
As shown above, the KDD process consists of five iterative stages. The process itself is interactive and involves numerous steps and decisions to be accomplished and made within each of the states.
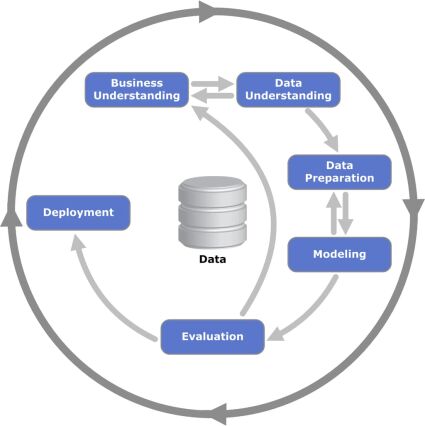
CRISP–DM (CRoss Industrial Standard Process for Data Mining)
Based on KDD and established by the European Strategic Program on Research in Information Technology initiative in 1997, aimed at creating a methodology not tied to any specific domain. The very first version of this methodology was present in 1999. There have been efforts and initiatives to create version 2.0 of this model, but, for now, the industry is sticking with version 1.0. For instance, IBM has been using it for years, and, moreover, released a refined and updated version of it in 2015 called Analytics Solutions Unified Method for Data Mining(ASUM-DM).
Analytics Solutions Unified Method for Data Mining
As you can see on the diagram, the process is iterative and the model consists of 6 main phases you can navigate. The arrows on the diagram show the most important and frequent dependencies between the phases, while the outer circle symbolizes the very nature of Data Mining in general. Apart from the machine learning application, CRISP-DM has been used widely in various research projects, like medical data analysis, evaluation of heating and air-conditioning systems performance.
Most researchers choose CRISP-DM for its usage in business environments as it provides coverage of end-to-end business activity and the lifecycle of building a machine learning system.
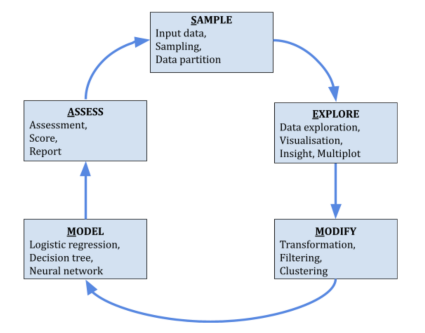
SEMMA (Sample, Explore, Modify, Model and Assess)
The SEMMA process was developed by the SAS Institute. The acronym SEMMA itself refers to the process(consisting of a cycle with 5 stages) for conducting a data mining project. These steps are incorporated in “SAS Enterprise Miner”, a product by SAS Institute Inc.
SEMMA (Sample, Explore, Modify, Model and Assess)
Unlike CRISP-DM, SEMMA mainly focuses on the modeling tasks of data mining projects, leaving the business aspects out of it. Nevertheless, I need to point out that it may be difficult to conduct Sampling without any business background of the data. Although it leaves some freedom to select the tools for DM, SEMMA is designed to help the users of the SAS Enterprise Miner software. Therefore, it may be tricky when it comes to applying it outside Enterprise Miner.
So…how do I mine?
A lot depends on our preferences here, which themselves consist of many factors. KDD is the oldest of frameworks, while CRISP-DM and SEMMA are its practical implementations. At the moment, CRISP-DM looks like the most complete iterative flow of receiving both bits of knowledge on stages and sharing the knowledge between stages. At the same time, SEMMA repeats the main phases of KDD, taking the understanding of the application domain beyond the process itself.
Here’s a summary of the correspondences among these three methods.
KDD
CRISP-DM
SEMMA
Pre KDD
Business Understanding
N/A
Selection
Data Understanding
Sample
Preprocessing
Data Understanding
Explore
Transformation
Data Preparation
Modify
Data Mining
Modeling
Model
Evaluation/Interpretation
Evaluation
Assess
Post KDD
Deployment
N/A
We can see that in general, the core phases are covered by all three frameworks and there is not a huge difference between these frameworks.
According to the survey by KDnuggets, a leading website of data mining, in 2014, 43% of respondents would choose CRISP-DM, 27.5% would go with the process of their own, 8% would align their process with SEMMA and 7.5% would use KDD.
As mentioned above, CRISP-DM is more suitable for business-driven systems and this is the choice I would pick. But whichever framework you choose, you need to handle….
Data Preprocessing and Feature Engineering
An old Arabic proverb says:
“Tell me what you eat, and I will tell you who you are”,
meaning that the person’s quality of nutrition can determine their character, wealth, and, of course, health. This proverb is also applicable to Data Science because the quality of the system for the output directly depends on what is used on the input; or as they say: “Garbage in, garbage out”. Regardless of the source of the dataset which you use to build an ML system, this same dataset needs to be polished, filled, refined, and in general, made sure you can really extract useful information from that data. That would be a simple explanation of what Data Preprocessing is.
Data Preprocessing is a complex term that means a variety of activities, starting from data formatting and up until feature creating. While analyzing a dataset, for example for an imbalance, in the future you can take into account the distribution of classes during the model creation; if you know which features are extra, you can perform the dimensionality reduction. Step by step, iteration after iteration, a dirty, unshapely rock can turn into a diamond. And on the output, you’ll have a diamond with that brilliant, ideal cut. I would even dare to suggest that the effort a data scientist makes on the data processing stage is equivalent to that of a jeweler refining a gemstone.
So, what are the approaches for effective Data Preprocessing:
data formatting in a perfect world, the data for the creation of ML systems might have been cleaned and formatted before it even reached a data scientist. But, since in real life we receive data from various data sources, the ways to store them and present them are different. Oftentimes, the final dataset is a CSV file, or it is assembled from other XLS/CSV files or exported spreadsheets from the database. When working with images, you need to group them into catalogs to make things easier for ML frameworks, although at first, the images can be stored in one pile with only tiny differences in titles.
data cleansing Formatted data means data in the format that allows it to be easily “fed” to an ML framework, but it doesn’t mean that there are no mistakes, no outliers (so-called anomalies) and all the data is in place. The right, correct data impacts the result, that is why the preparatory purge of data before further preprocessing matters – this is a key activity. Most often you’d face:
missing data missing data – simple at first glance, but things could be different in practice. The approaches you can use to fill in the blanks depend on the kind of data that’s missing (numerical or categorical). For numerical, for example, we can take mean figures, for the categorical – the most frequent values to fill in;
duplicates – as you know, the same data in the dataset does not positively affect the accuracy and performance of the model, while the variability directly does;
structural errors – typos, errors in classes’ names
outliers – ohhh, these guys are tricky and a well-known practice to sort them out would be to feed the data to another ML system designed specifically to handle that.
data aggregation It’s great when there’s a lot of data, but sometimes there’s too much and we need to shorten the amount without losing out on quality. Aggregation may be applied to rows and attributes of data. As a result – the dataset is smaller and requires less machine time and memory for data analytics.
data sampling This is the process of data selection from the general dataset for analysis. The main peculiarity of sampling is that this subset of data can be representative, meaning it cannot be imbalanced. In practice, we can apply simple random sampling & sampling with/without replacement.
Feature Engineering Ohhh…this one is huge as it includes a lot of activities and some of them are deeply interconnected with the already mentioned ones:
handling categorical data Features of the sample that can take only particular values(i.e state, city, address, color) are called categorical data. Categorical data can be split into ordinal(values that can be sorted or ordered, i.e. size of T-shirt) and nominal(don’t imply order, i.e. color name) values. Unfortunately, ML algorithms do not work with string data, which means that we need to convert string values to integer values. Keeping in mind the difference between ordinal and nominal data, conversion is to be done with the preservation of a sense of ordinal data values. The main techniques here would be mapping ordinal features, label encoding, one-hot encoding, and dummy variable encoding.
feature scaling The purpose of this procedure is to bring numeric features to the same scale, as ML algorithms tend to favor features with bigger numeric values and diminish the usefulness of features with small numeric values. There are two common approaches to deal with this problem: normalization & standardization. Both of them are used widely and sometimes(depending on the ML algorithm being used) interchangeably.
dimensionality reduction The number of variables or features in the machine learning dataset defines its dimensionality. Thus, dimensionality reduction means the process consisting of approaches or activities that would decrease the number of features. Too many features lead to larger memory volumes needed to process data; longer processing time; overfitting problems; the curse of dimensionality. We could actually combine this section with the following one: feature selection, but there’s still a difference between them: dimensionality reduction produces a new set of features for the object when after the feature selection procedure you end up with the set of the most useful existing features.
feature selection Ok, now we know what it basically does, let’s take just a sneak-peek into the methods being used here:
filter methods – features are selected and ranked according to their relationships with the target;
wrapper methods – it’s a search for well-performing combinations of features;
embedded methods – select those features that contribute performance of the model the most, and it’s performed during training of the model.
feature creation
Basically, this is the process and creation of new features that would contribute to the model better than the existing ones. It involves many activities, like mapping data to new space, discretization, and even mentioned above feature scaling. Per my vision, any data transformation resulting in a new field that contributes to an ML system is a feature-creation process.
Just keep in mind the one thing while doing Data Preprocessing and Feature Engineering: good models are made of relevant features, and not of more features!
In the End
I’ve tried to cover in this material in a detailed enough, but not too filled with mathematical and programming terms, way – which is the data collection process as well as data preparation for the creation of efficient ML systems. This is an area of Computer Science that develops at a very fast pace, with its own difficulties and methods of building complex programs. As shown in this document, the most common challenges a data scientist tackles while building an ML system have to do with:
properly formulated business problems to be solved with data
data collection process
quantity and quality of input data
feature engineering (well, I wouldn’t call this an issue, but more of a process of creating art).
All of them are tightly coupled together and fixing one of the issues at the surface would automatically help fix the ones below, i.e. having a data collection strategy integrated into the service or product lifecycle increases the quantity and enhances the quality of data making feature engineering activities more engaging and less routine, as you stop wasting time with data issues, but spend more time getting new information from the data instead! And this is what makes Machine Learning and Data Science so exciting and even thrilling!